Society
As a family-owned company, we are committed to giving future generations a brighter tomorrow. We believe that creating a positive impact and running a sustainable business go hand in hand.
Our sustainability strategy is built around three key goals: creating meaningful jobs, improving quality of life and protecting the future of our planet. It also strengthens our communication with customers and prepares us for new regulatory requirements, most notably, the upcoming Corporate Sustainability Reporting Directive (CSRD).
Corporate Sustainability Reporting Directive
Under current legislation, starting in 2025, large companies will be required to disclose their social and environmental impact under the CSRD. In 2024, we continued our preparations for the implementation of this directive. These preparations will continue in 2025, and we are confident we are on track for reporting under CSRD.
The essence of the CSRD is transparent and structured reporting on topics that are material to a company’s sustainability strategy. This means documenting our sustainability governance and policies, how we identified our most material sustainability topics, what targets we have set and how we are tracking progress.
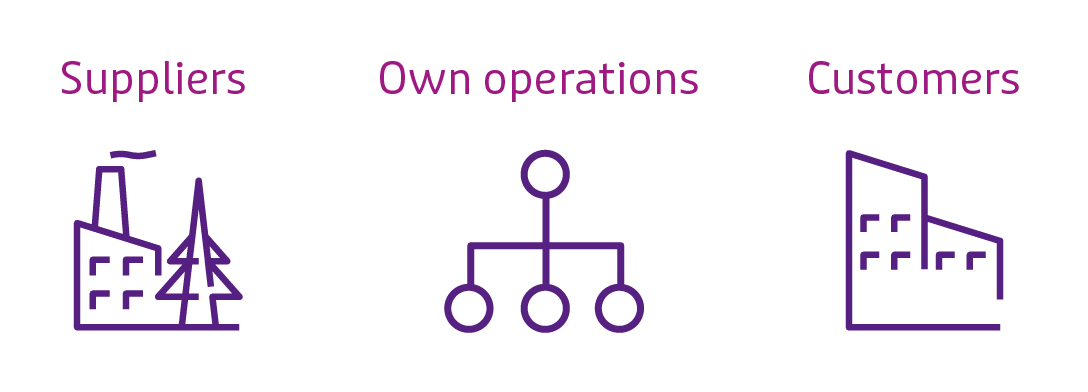
The CSRD also goes beyond our company’s own operations. It requires us to assess our full value chain, from suppliers (upstream) to customers (downstream) and understand both how we affect the world (inside-out), and how sustainability risks and opportunities affect us (outside-in):
This work has allowed us to adopt a more structured, forward-looking approach to our sustainability strategy. In particular, we:
assessed potential impacts, risks and opportunities across a range of environmental and social topics;
determined which impacts and risks are most relevant to our sustainability strategy;
will introduce performance management for all material topics, including setting baselines, defining targets, creating action plans, collecting data and tracking progress.
Alongside the strategic work, we also reviewed the availability of the data we need to meet CSRD’s disclosure requirements. In areas like emissions and circularity, we’ve already closed many of the key data gaps, putting us in a strong position to report with accuracy and confidence in the years ahead.
In early 2025, the European Commission presented the Omnibus Package, aimed at improving the EU's competitiveness and increasing prosperity and economic growth across the European Union. The package includes proposals to alleviate the burdens on business, including those related to the CSRD. The next step is for both the European Parliament and the Council of the EU to review and adopt their respective positions on the Omnibus proposals. This will be followed by ‘trilogue’ negotiations. Adoption of the proposal is not expected before the end of 2025.
The following elements of the Omnibus Package are particularly relevant to Vebego:
Delayed implementation of the CSRD by two years (i.e. reporting in 2027 instead of 2025).
Reduced number of disclosure requirements.
In light of the Omnibus Package discussion, and the likely delay and adjustments to the disclosure requirements, Vebego will ‘pause’ certain compliance-related activities. These activities focused on preparing for the disclosure requirements, ensuring data availability and developing the required content applicable to Vebego. Of course, we will not pause setting and executing our sustainability strategy.
Double materiality assessment
Conducting our double materiality assessment is a cornerstone of CSRD reporting. This process examines impact materiality, i.e. the effects our organisation has on people and the planet, and financial materiality, how sustainability issues could pose risks and create opportunities for our business.
Performing such an assessment requires different approaches, depending on the combination of the sustainability topic and its stage in the value chain.
The outcome of this assessment is shown below:
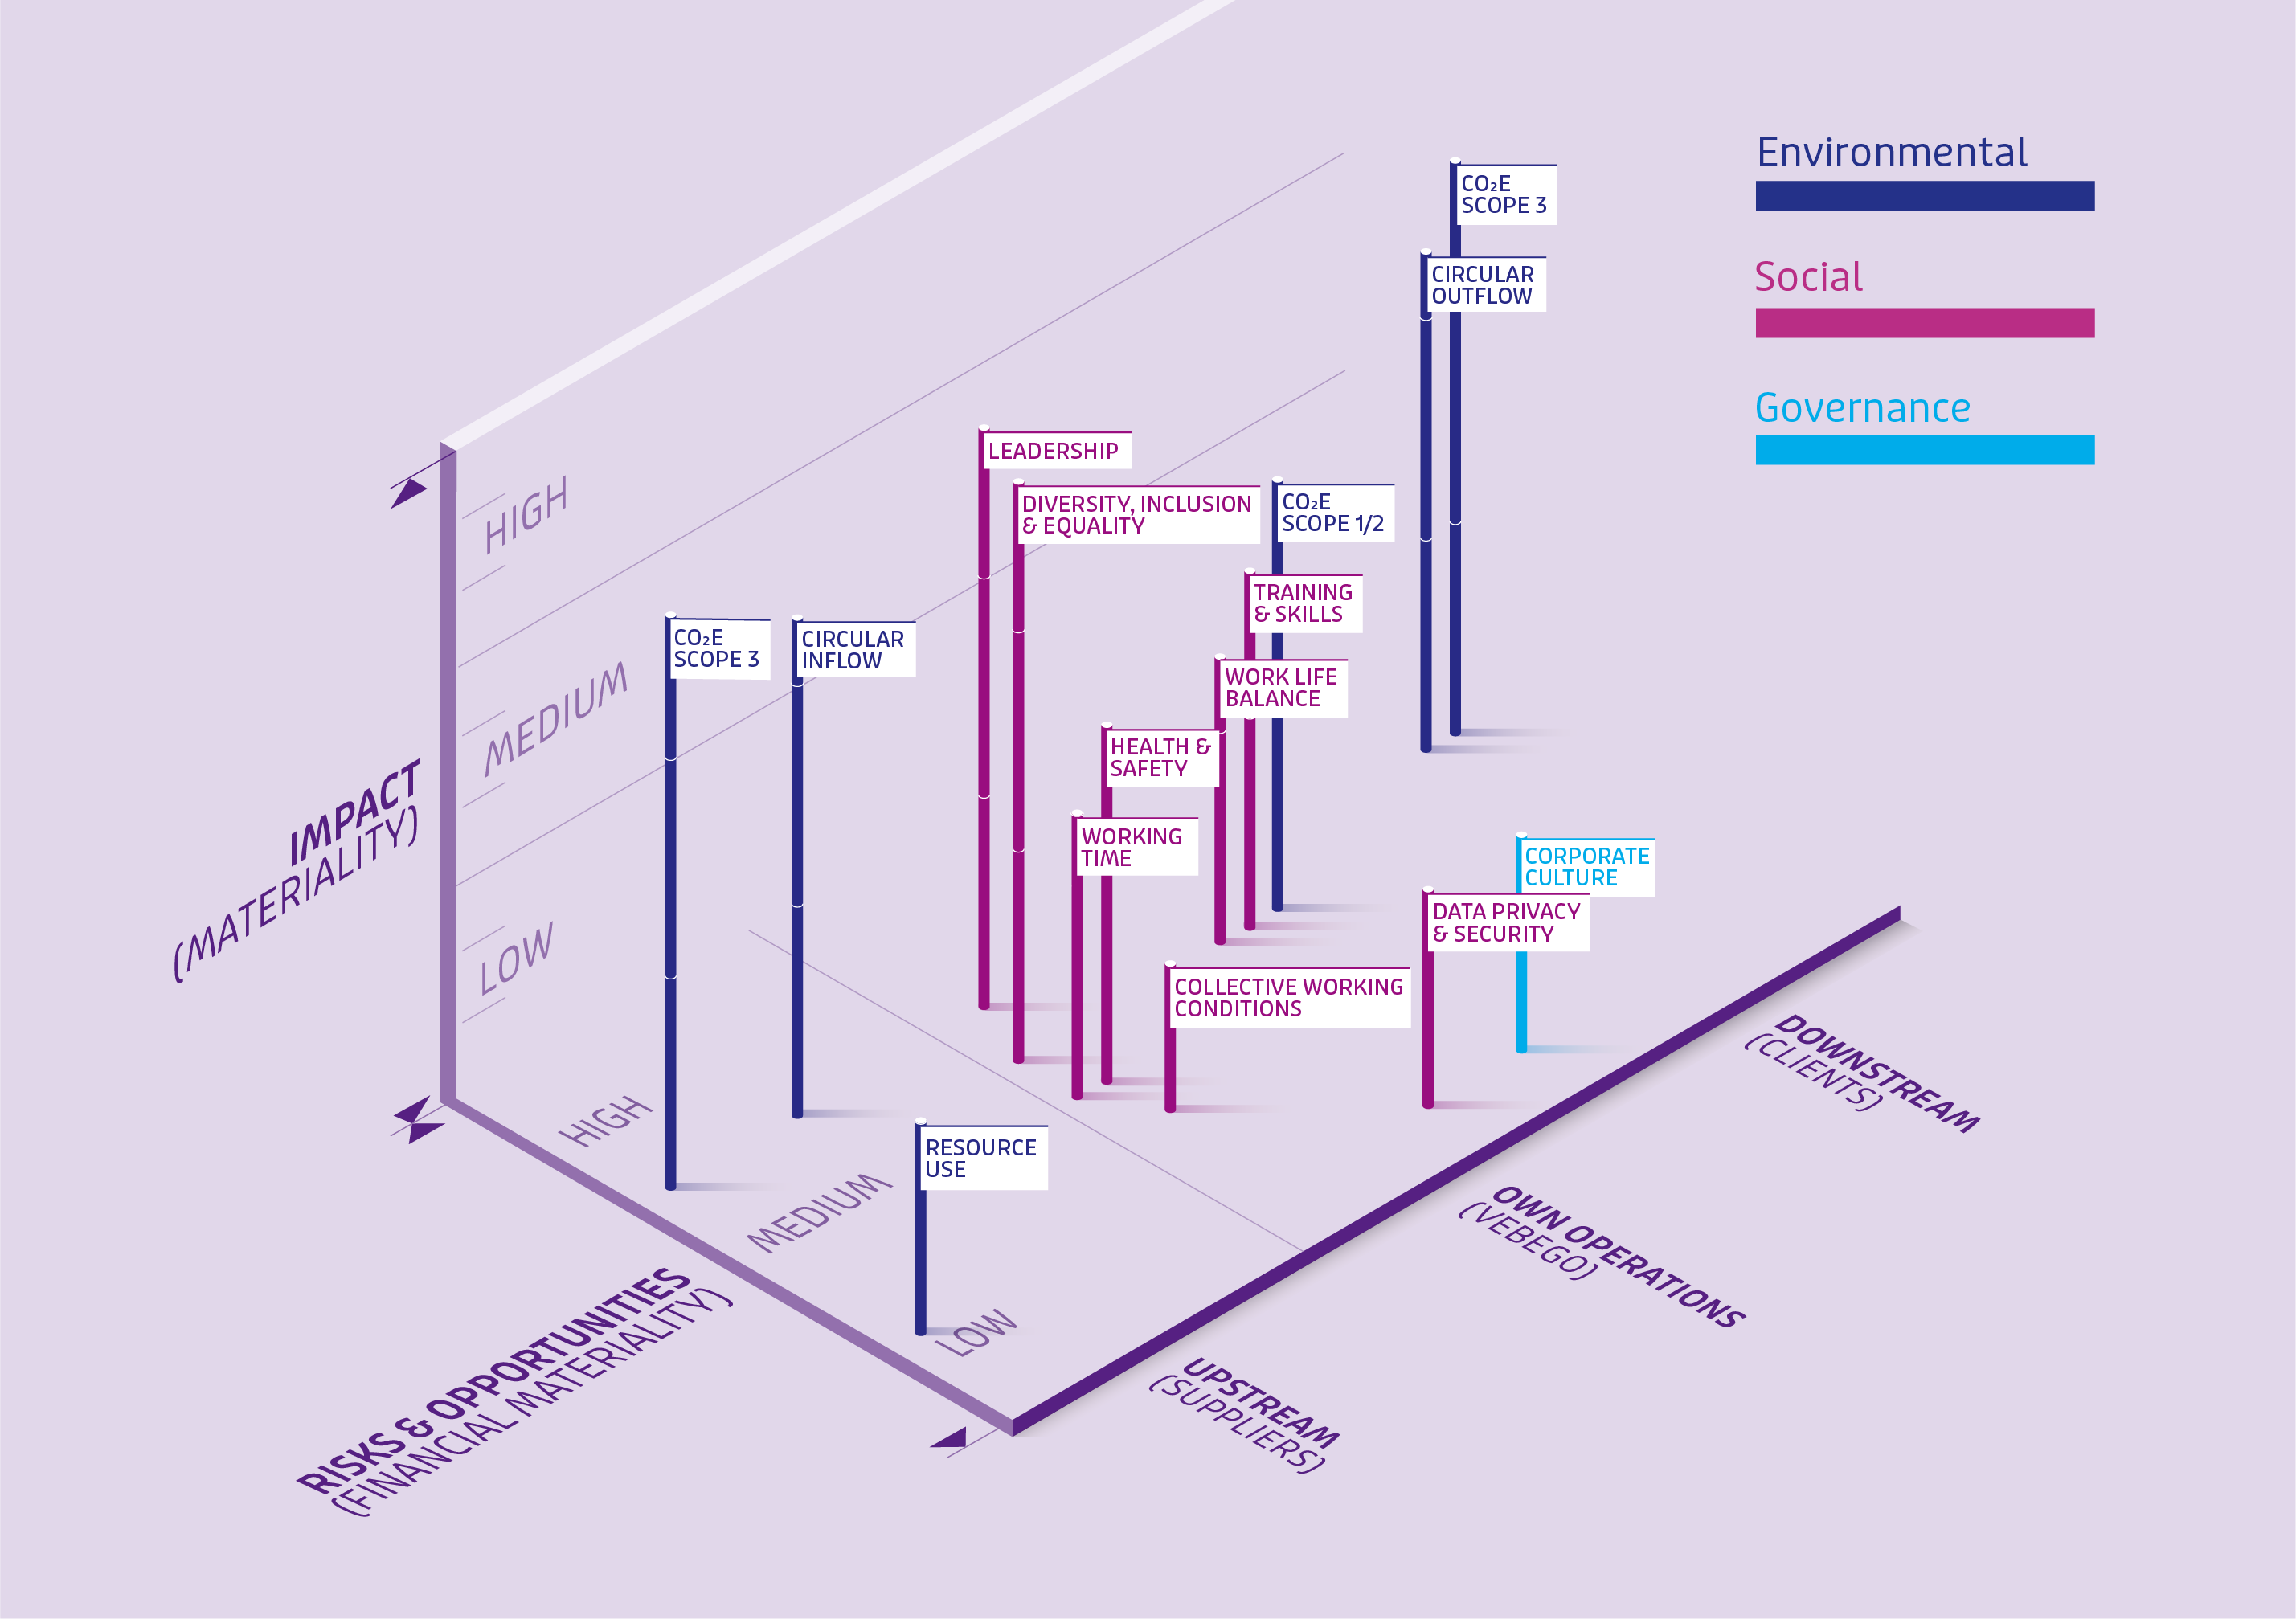
Within the topics we have defined as material, we have classified them in different ways:
Topics that are already included in our strategy and execution, or will be during 2025.
Topics where we are already where we need to be, the focus is on maintaining this position.
Topics that will be addressed at a later stage. These topics have a lower priority, based on the rating as visualised above.
For several topics, we are still conducting further investigations and gathering data to determine whether they are material to us and, if so, how they can be defined.
In the environmental domain we are investigating any negative impact on water (usage), pollution and biodiversity across our value chain, coming from our activities and the products we use. The potential impacts are tracked through our Digital Product Passports (DPP), holding details of water use and materials included in our products. The assessment will therefore be ongoing until we have achieved our targets for products covered by a DPP. We expect this to happen around Q3 2025 and therefore anticipate completing this assessment by then.
In the Social domain, we are assessing the impact of purchased products and services, particularly on workers in the value chain and affected communities. Given the scale of our value chain and number of (sub-)suppliers, this is inherently challenging. In 2024, a shortlist of potential high-risk areas, including fair wages, equal pay, and health and safety, was developed and will be further explored in 2025.
Performance management
Once a topic from our assessment is integrated into our sustainability strategy, we must ensure adequate performance management. Performance management can be visualised as follows:
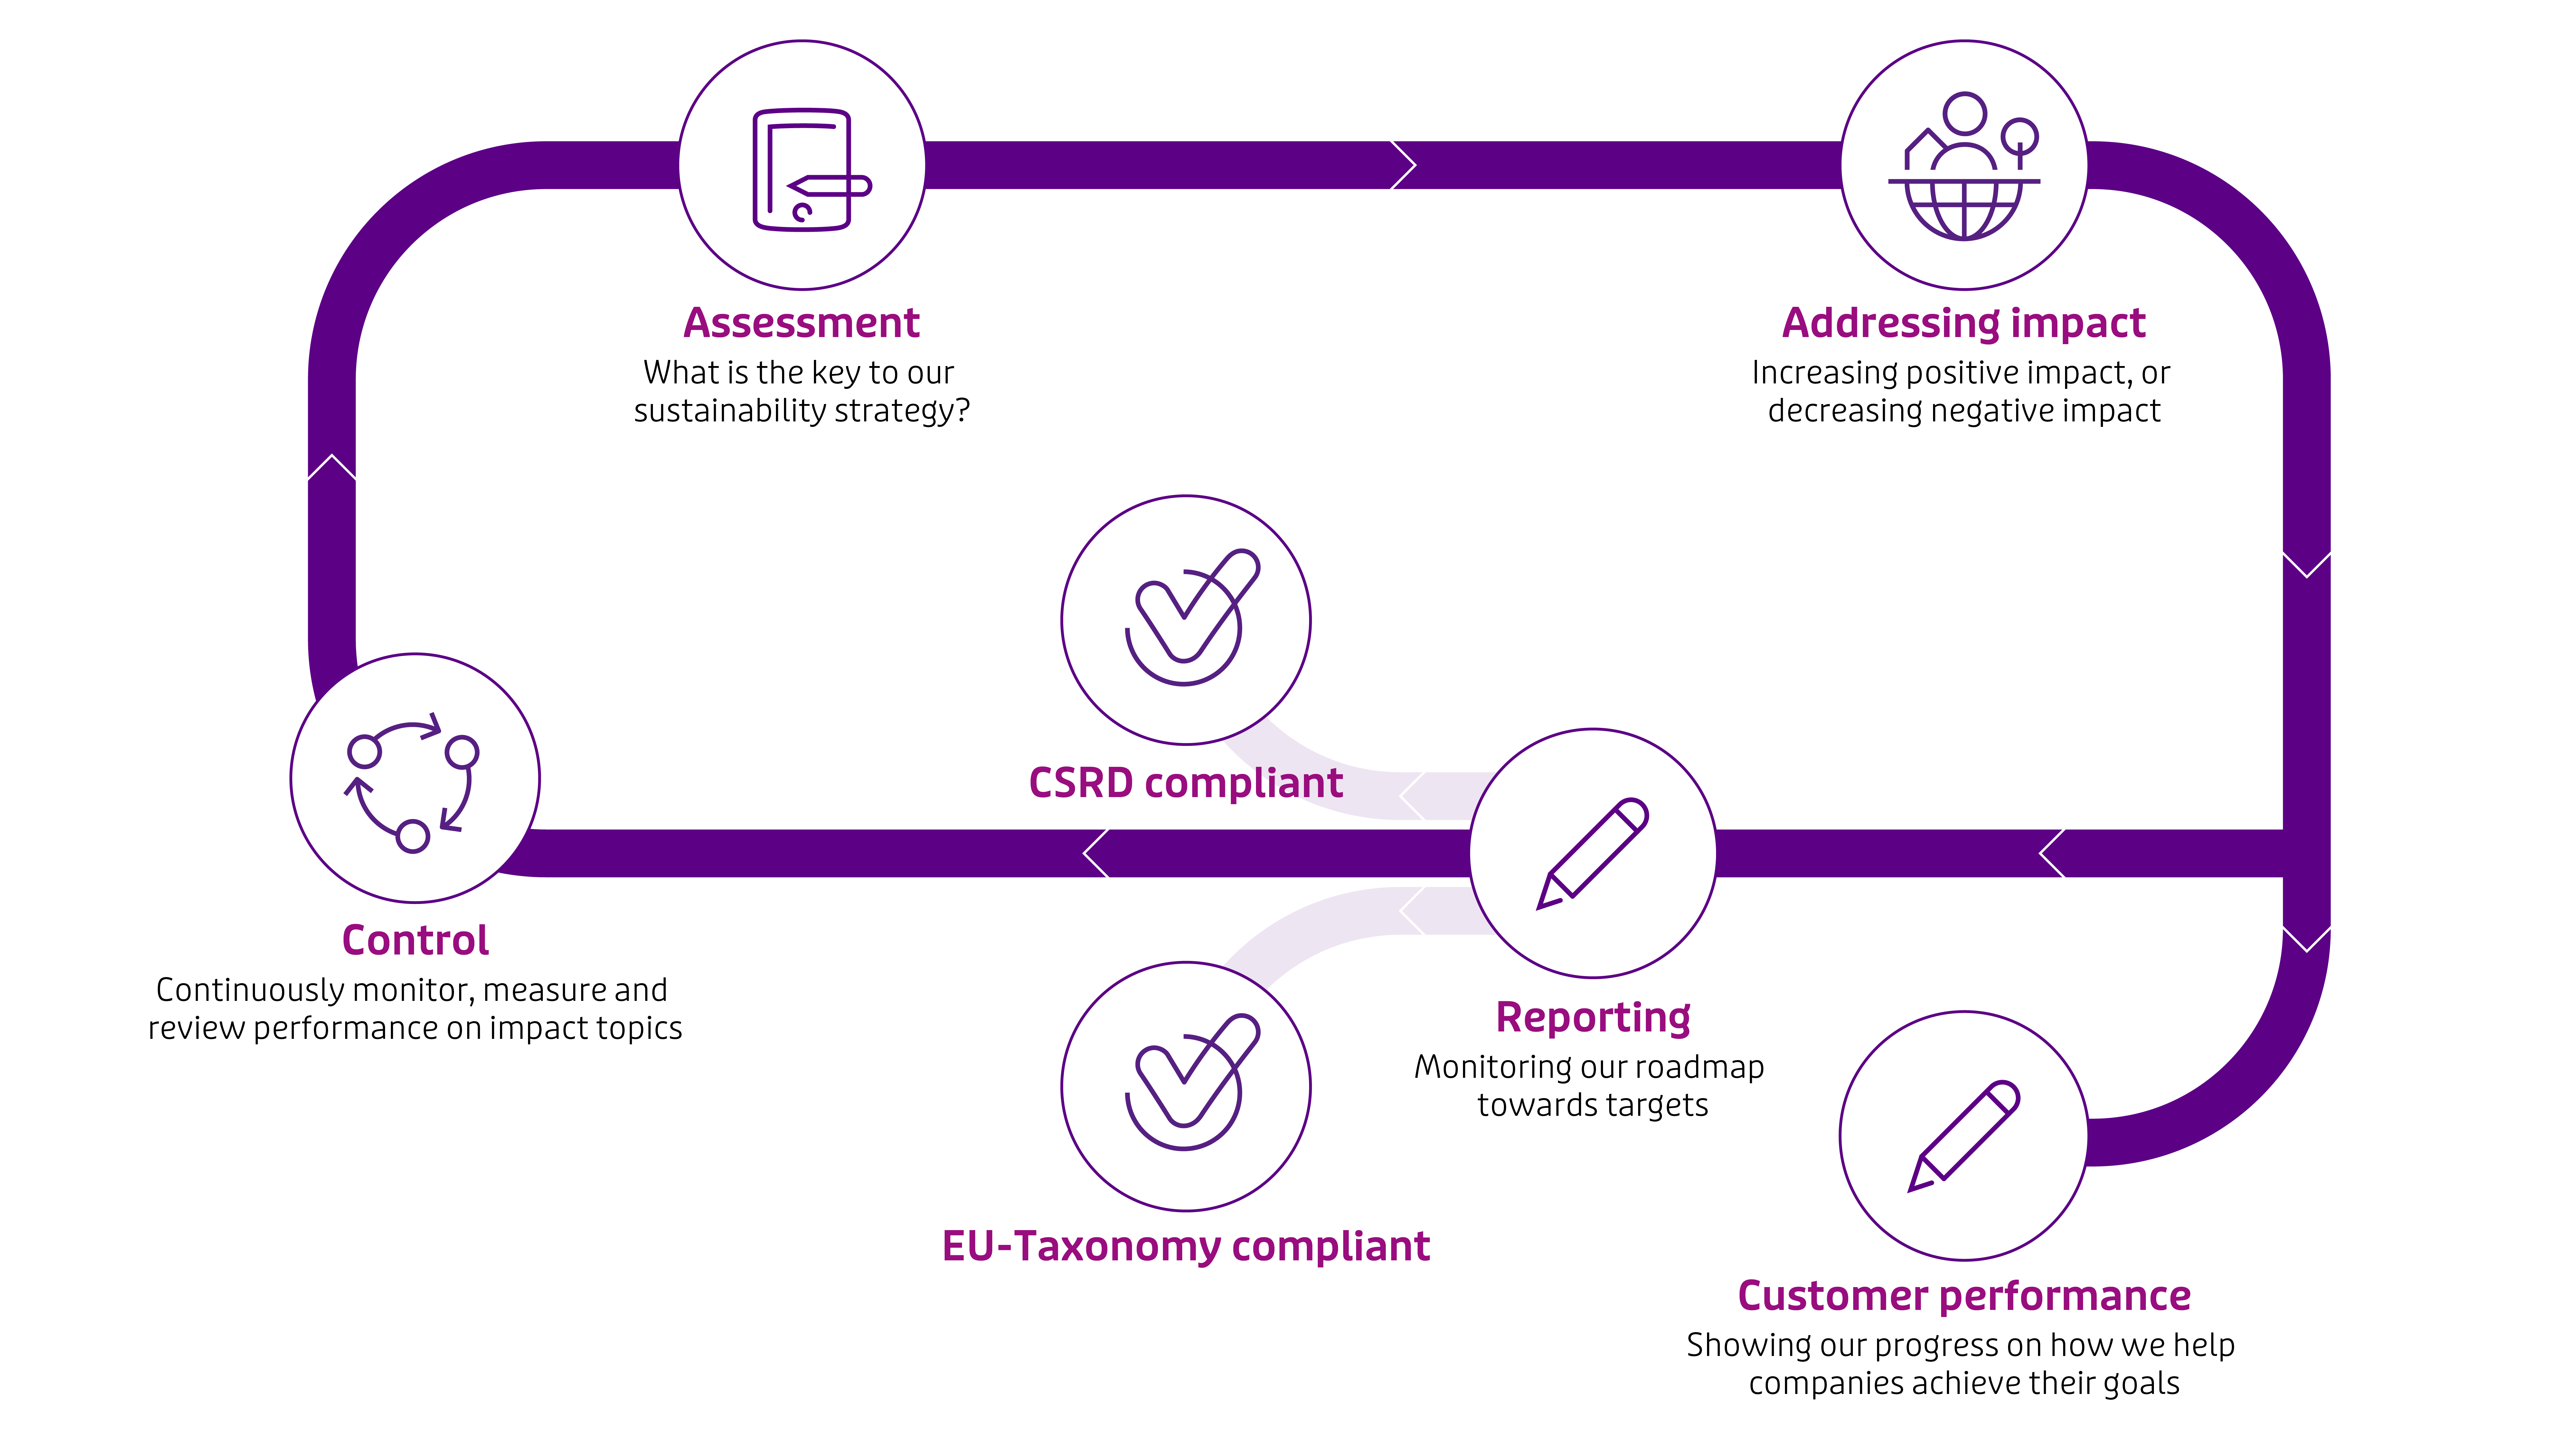
Below we will highlight the status of performance management and progress towards our targets for each of our strategic topics.
Greenhouse gas emissions
Vebego is committed to reducing its CO₂e footprint. This reduction must be achieved throughout our value chain. In our policy and approach, we distinguish between the footprint of our own operations and our upstream and downstream footprint. We have relatively more direct control over the footprint of our own operations than over the upstream and downstream emissions. Our segmentation follows the guidelines of the Greenhouse Gas (GHG) Protocol.
Greenhouse gas emissions (CO₂ equivalents): own operations
The footprint of our own operations includes fuel and gas consumption (Scope 1 of GHG), electricity consumption (Scope 2), and commuting and business travel (categories 6 and 7 within Scope 3).
Our companies are responsible for setting ambitious yet realistic targets for reducing their footprint on their own operations. This is done based on roadmaps prepared by the companies for their specific situation. These roadmaps outline the initiatives that are currently underway and will be implemented in the future (such as electrification of the fleet, the use of green electricity, green gas, and reduced commuting), the resulting footprint reductions, and the associated costs and investments.
The CO₂e footprint of our companies for the full year 2024 (and comparative 2023) was as follows:
CO₂e emissions per category (in tonnes) | 2024 | 2023* | |||
Scope 1 | Heating | 1,051 | 1,377 | ||
Mobile Combustion | 11,889 | 13,129 | |||
Scope 1 - Total Own Operations | 12,940 | 14,506 | |||
Scope 2 | Electricity (market based) | 2,388 | 1,284 | ||
Scope 2 - Total Own Operations | 2,388 | 1,284 | |||
Scope 3 | 3.3: Upstream Fuel- and Energy-Related Activities | 4,369 | 4,522 | ||
3.6: Business Travel | 850 | 389 | |||
3.7: Commuting | 15,383 | 2,878 | |||
Scope 3 - Total Own Operations | 20,602 | 7,789 | |||
Own operations GHG emissions - (market-based) (CO₂e) | 35,930 | 23,579 | |||
Scope 3 | Products & Services** | 94,060 | 74,217 | ||
3.8: Upstream Leased Assets | 614 | unknown | |||
3.11: Use of Sold Products | unknown | unknown | |||
Other Scope 3 | 94,674 | 74,217 | |||
Total GHG emissions - (market based) (CO₂e) | 130,604 | 97,796 | |||
- * In 2023 the CO₂e emission factors in Scope 1 and Scope 2 were calculated using the Well-to-Wheel (WTW) method. In 2024 this method has changed: within Scope 1 and Scope 2 we account for emissions originating from Tank to Wheel (TTW) and under scope 3, Upstream Fuel- and Energy-Related Activities, we account for emissions from Well-to-Tank (WTT). The comparative figures 2023 have been adjusted accordingly.
- ** This includes CO₂e from: 3.1. Purchased Goods & Services, 3.2. Capital Goods, 3.4. Upstream Transportation & Distribution, 3.9. Downstream Transportation & Distribution & 3.12. End-of-Life Treatment of Sold Products
As shown, the total CO₂e footprint of our own operations has increased significantly compared to 2023, from 23,579t CO₂e in 2023 to 35,930t CO₂e in 2024.
This increase is the net effect of:
Extending the scope of CO₂e reporting to all the companies in the Vebego Group. Additional companies have been introduced to Vebego's sustainability reporting policy and are now required to report on CO₂e, though they did not do so in 2023 (effect +2,916t).
Increase due to improved data quality and completeness of commuting (effect +10,505t).
Acquisition of the Hoek Group (effect +700t).
Decrease due to other causes such as the implementation of CO₂e reduction measures by our companies (mainly electrification).
The above can be visualised as follows:
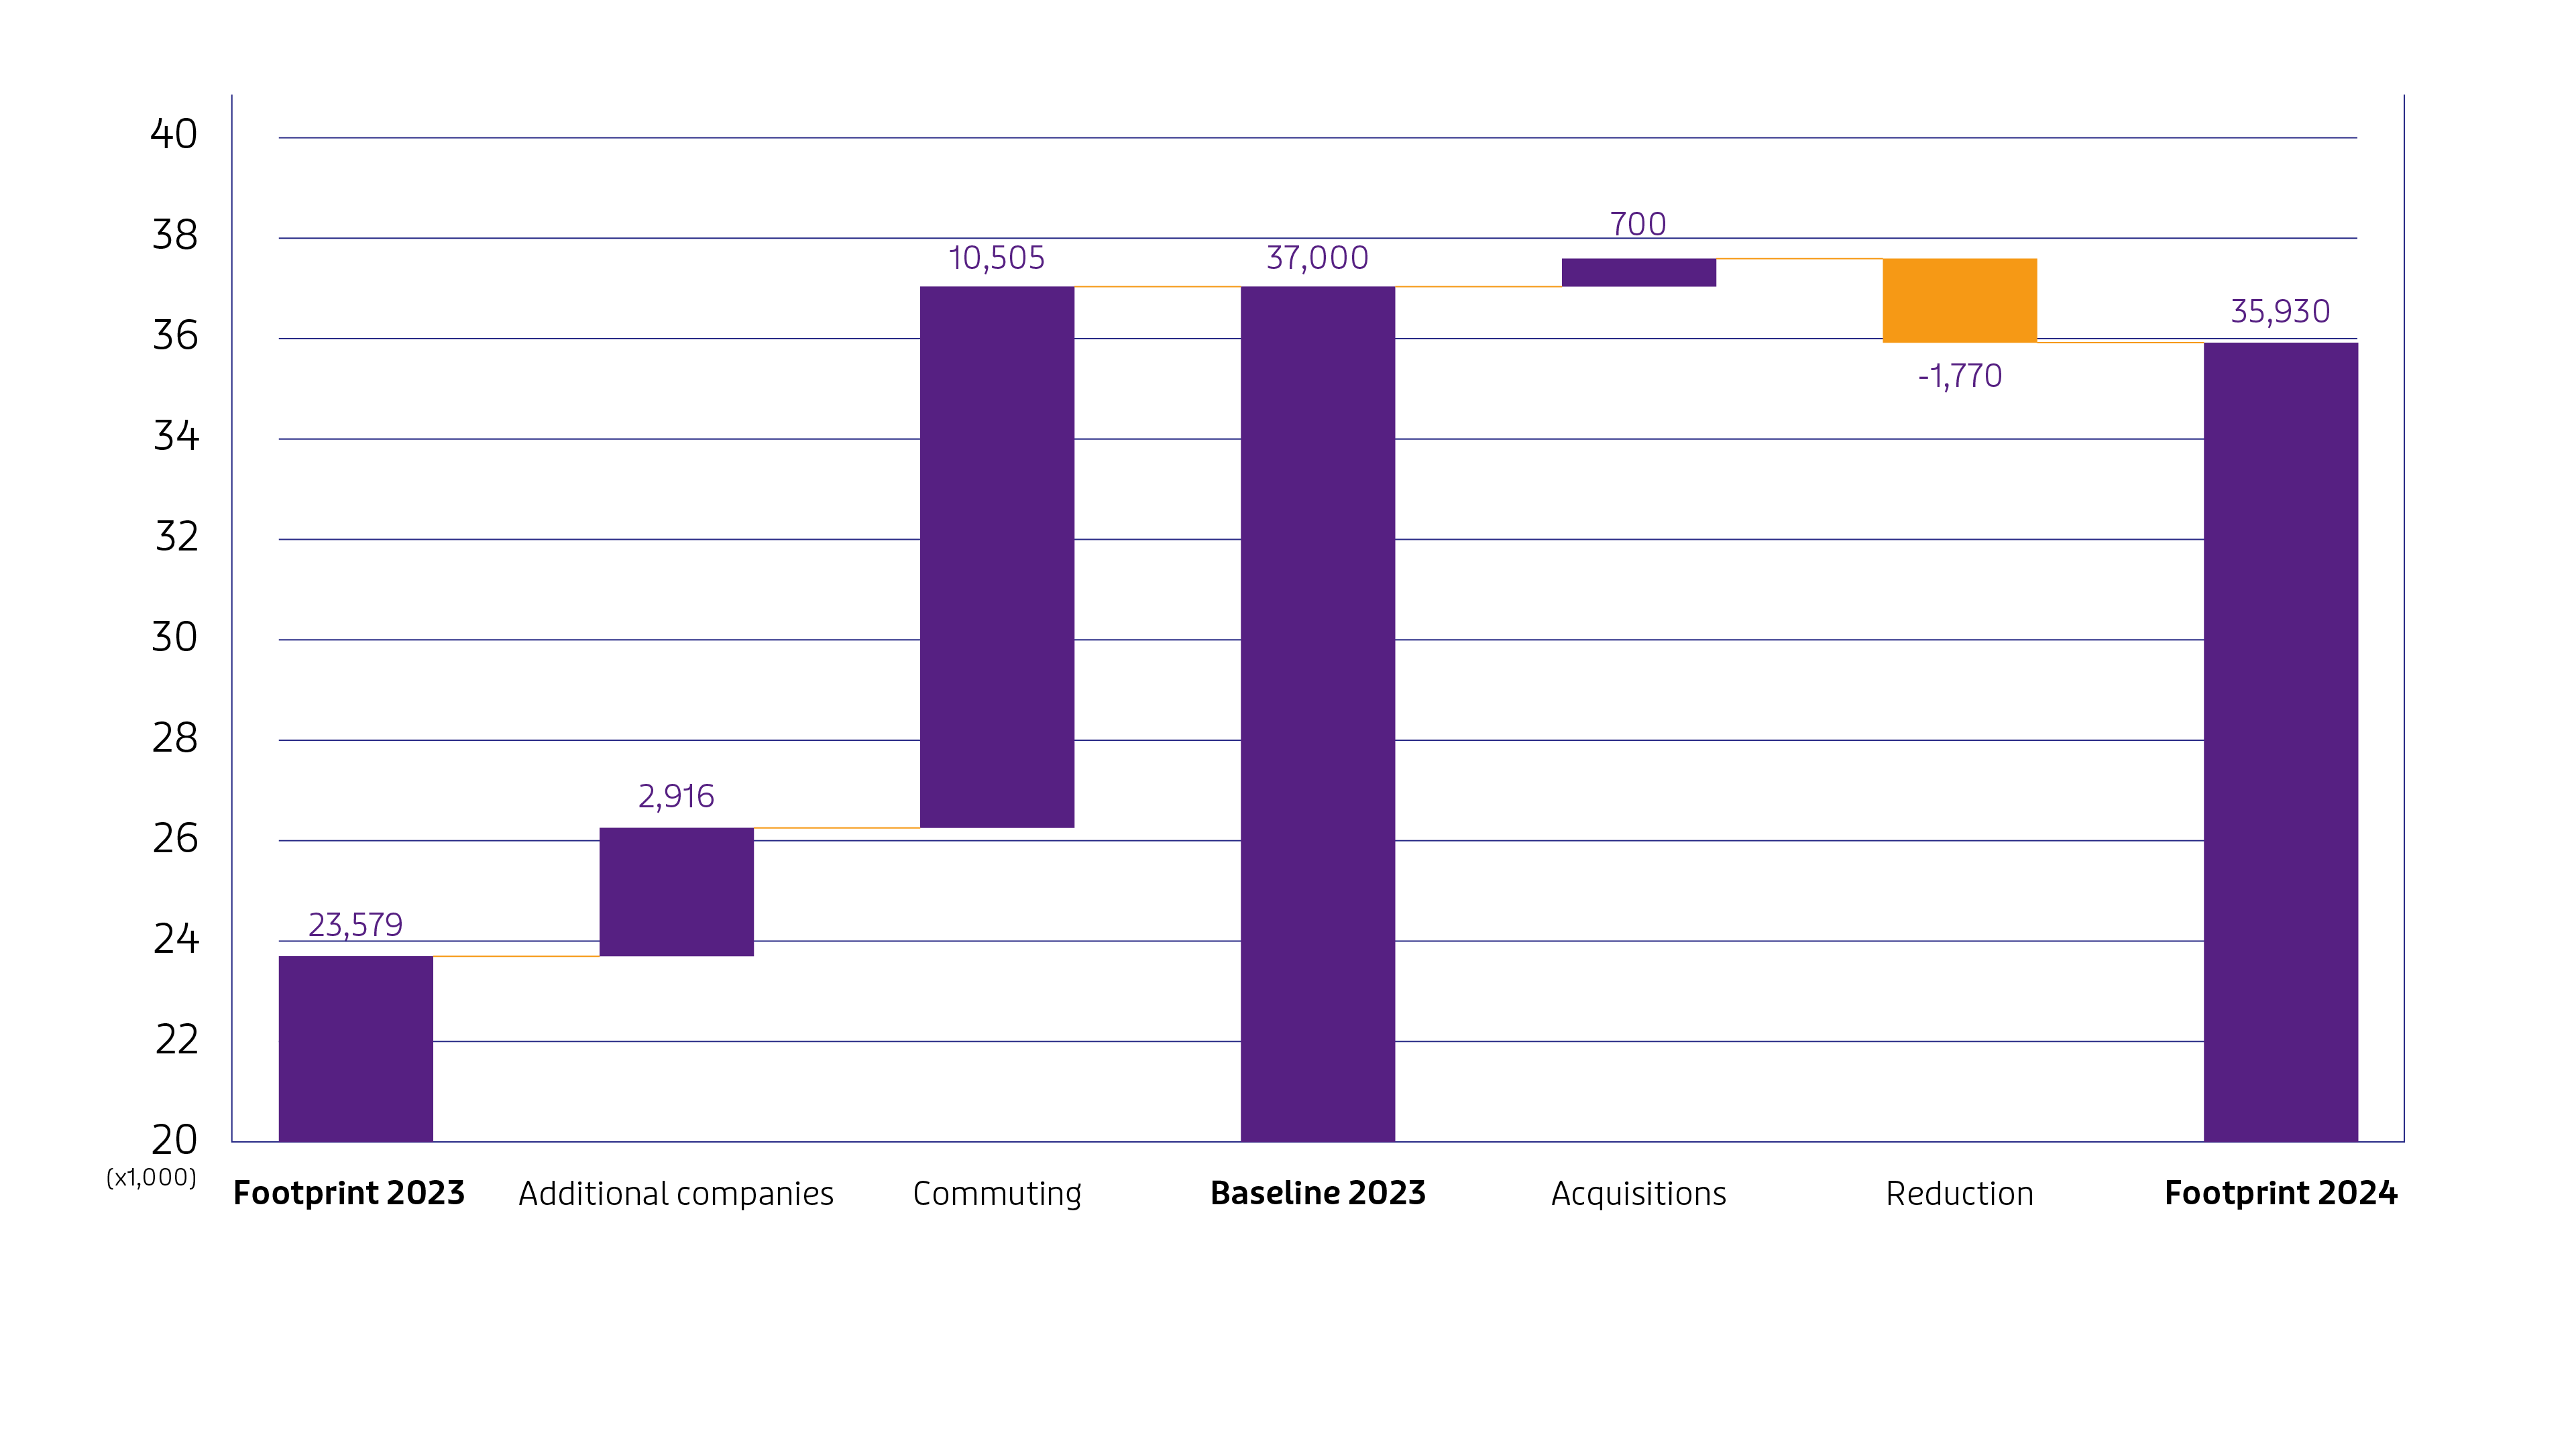
To achieve our CO₂e reduction target, it is essential that we continue to focus on our roadmaps and secure the resources to implement them. Therefore, in 2024, the company's roadmaps were updated, and their quality was improved where necessary. The roadmaps were further detailed, and the effects on the CO₂e impact of each measure were quantified. This bottom-up approach has led to a revision of the reduction target 2030 compared to 2023. The target for reducing CO₂e from own operations has now been set at 50%. In the 2023 baseline, the effects of extension of companies and improving data quality on commuting have been included, putting the baseline at 37,000t of CO₂e.
Our companies are fully focused on implementing their roadmaps and reducing CO₂e. In 2024, adjusted for acquisitions, we achieved a reduction of around 4.8% compared to the baseline. This marks an improvement over 2023 – when our emissions remained stable at 2022 levels. The electrification of our fleet contributed to this decrease. The aim would be to achieve on average a reduction of ~7.1% per year to reach the 2030 target, so we need to increase our reduction efforts.
As we work to reduce emissions from our current operations, we should also ensure that our future business growth, whether organic or through acquisitions, aligns with our 2030 reduction target. To this end, we monitor and manage our footprint in relation to the scale of our business activities, using turnover as a reference metric. By linking our 50% target to the net turnover, in 2030, our emissions should not exceed 13 grams of CO₂e per euro of net turnover. Our baseline footprint is 25 grams per euro of net turnover, and in 2024, emissions dropped to 24 grams per euro of net turnover. For accurate year-on-year comparisons, net turnover is adjusted for inflation, as price increases, if uncorrected, could lead to an artificial decrease in grams of CO₂e per euro without reflecting real progress.
The footprint divided across the different scopes is as follows (in tonnes of CO₂e):
Greenhouse gas emissions (CO₂ equivalents): Scope 3 (upstream and downstream)
By far the largest contributors to Scope 3 upstream are the goods and services that Vebego buys. The Scope 3 downstream footprint mainly comes from the use and the end-of-life treatment of products. Based on the products and services we procured in 2023 and 2024, we have made a very rough estimate of the resulting Scope 3 footprint.
This estimated footprint amounted to 74,217t of CO₂e emissions in 2023 and 94,060t of CO₂e emissions in 2024. The increase is mainly the result of including more companies in scope.

The footprint of products is mainly based on available Digital Product Passports. The DPP provides the footprint from ‘cradle to grave’, i.e. all emissions generated in the value chain, from raw material extraction, through production and transport, to end-of-life treatment. By the end of 2024, DPPs were already available for half of the Alpheios product volume, which is primarily comprised of products directly related to our core activities. For products that do not (yet) have a DPP, the footprint is based on the DPP-average CO₂e per kg weight of products or the DPP-average CO₂e per 1 euro spent on products. For services, the footprint is largely based on ‘segment intensity’, i.e. the average CO₂e emissions per 1 euro spent in a given service segment.
More important than reporting on the footprint is taking measures to actually reduce the Scope 3 footprint. Within Vebego, we address the CO₂e of products using the DPP as a basis. The information in the DPP helps us to work closely with our suppliers to determine how to reduce material use, use alternative materials and increase circularity. Circularity is the main driver of CO₂e and is discussed in more detail below.
In all our strategic core companies, we are also beginning to engage with service providers. As we have a significant supplier base, we use volume as a method to prioritise which suppliers to approach first. We ask for a footprint tailored to the services they provide to Vebego. Based on that, we initiate a discussion on how to actually reduce the footprint and how to implement these measures.
Addressing the footprint of products and services takes a lot of time and involvement from different disciplines (sustainability, procurement and contract management). Scoping the efforts and securing resources is therefore key.
A CO₂e dashboard has been developed for reporting and control purposes. This dashboard shows the footprint across all scopes and categories for each of our Group companies. The intention is to further allocate all footprints down to the customer level within our companies.
Circularity
Reducing the volume of products and materials we use, while increasing circularity, is highly beneficial across a range of environmental topics. It is also the main driver for reducing our upstream CO₂e footprint caused by ‘purchased products’ and the downstream footprint related to ‘end-of-life treatment of sold products’. We aim to maximise the use of renewable and recycled materials in our products and to promote the reuse and recycling of our products at the end of their life, thereby minimising waste.
This can be achieved through design, materials used in our products and recycling. Increasing our circular inflow (using different materials and products) means constantly finding new balances between increasing circularity, affordability and quality. Progress also depends heavily on innovation and market developments.
Of course, we cannot cover the whole range of products. That is why we focus on those products that make up the largest part of the total volume we buy. Alpheios accounts for by far the largest percentage of product volume. Other Vebego companies that do not buy their products through Alpheios also need to increase their circularity.
Alpheios and other companies have developed and are continuously updating roadmaps with initiatives, including when these initiatives are expected to take effect, the resulting footprint reduction, any adverse impacts on water, pollution, biodiversity and the associated costs and investments.
The management of circularity takes place at product level. The DPP helps to get a clear view of the level of circularity of each product. Currently, only Alpheios is preparing DPPs for its (cleaning) products. The figures below therefore only refer to products sourced through Alpheios.
At the end of 2024, we had prepared the DPP for 217 products. Although this represents only 6% of Alpheios products, it covers around 50% of the total volume by weight. The aim is to have enough DPPs in place by 2030 to cover 75% of our volume by weight.
Circularity can be divided into ‘circular inflow’ (the materials used in the products we purchase) and ‘circular outflow’ (the products we use in our business or sell to external parties). Our ambition is that by 2030, most of the materials used in our products will be circular.
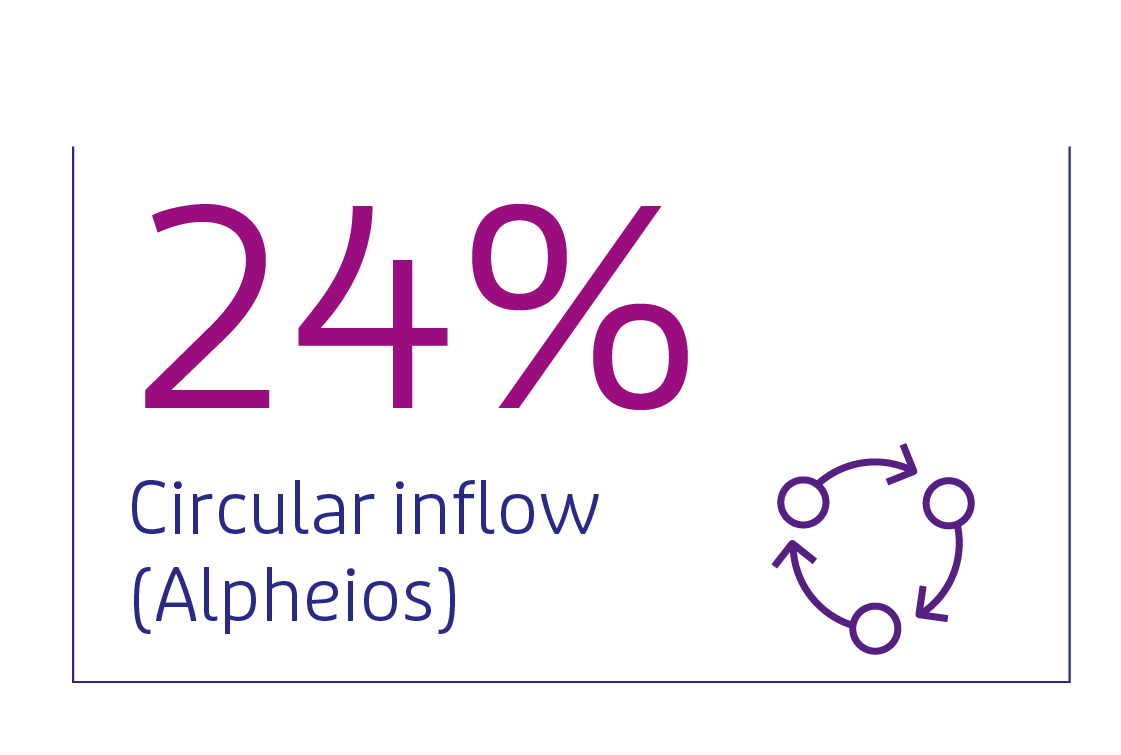
For inflow, our target is to be at least 50% circular by 2030. We aim to achieve a 70% circular inflow, on 75% of weight. In 2024, we achieved a 48% circular inflow, accounting for 49% of the total weight, resulting in 24% circular inflow.
As products are also sourced outside of Alpheios and no DPPs are prepared for these products, the actual circular inflow in 2024 is lower than the 24%.
A circularity dashboard has been developed for reporting and monitoring purposes. This dashboard shows circularity for any combination of company, product and customer.
EcoVadis
EcoVadis is an evidence-based online supplier sustainability rating platform. This platform enables Vebego to assess the ESG performance of specific suppliers. The results are presented in a scorecard that provides a clear overview of a supplier’s strengths and areas for improvement.
As we require (some of our) suppliers to use EcoVadis, we have decided that our companies should, when beneficial to them, also use the EcoVadis methodology to rate themselves. For some of our companies, the rating also supports their commercial processes.
Diversity & Inclusion

The world around us is changing – and so is the workplace. As more generations, cultures, and backgrounds come together, there is a growing shift from division to connection and sharing. Today’s workforce is a colourful canvas of people from diverse backgrounds: people of different faiths, racial and ethnic identities, who speak various languages and celebrate diverse holidays.
Vebego embraces this diversity. We recognise and respect society’s diverse groups of people and aim to create a workplace where everyone feels equal and can be their best self.
For over 80 years, it has been in our DNA to focus on what is possible and to see potential where others might see limits. In 2021, we signed the Diversity Charter, taking a formal step in turning our intentions into a concrete action plan. Since then, we have focused on areas such as representing diverse talent and promoting equal opportunity. This has brought us to where we are today, building a stronger foundation of awareness within our organisation.
Real change starts from within. It means learning to listen to other perspectives, setting aside assumptions and acknowledging that there is no single truth, only genuine curiosity about one another so we can connect on a human level.
We measure our diversity and inclusion data both at the top and sub-top levels within our organisation. Our strategic target is to reach the EU target of 33% women in the sub-top by 2025.

In Germany and Switzerland, the management teams are still predominantly male. Improving the gender balance in these teams takes time, as it depends on natural outflow, culture, gradual change and finding the right candidates. We are currently exploring how to improve the ratio in these countries. For example, when filling current vacancies, we are explicitly seeking qualified women as preferred candidates.
At the top of the organisation, we have set a clear diversity goal: both our Supervisory Board and Strategic Leadership Team aim for at least 40% female representation. By the end of 2024, this target had been achieved, with both the Supervisory Board and the Strategic Leadership Team made up of two women and three men. The Board of Directors consisted of two women (50%) and two men in 2024.

People facing barriers to employment
At Vebego, our mission has always been about more than providing services. It is also about providing meaningful work and improving people’s quality of life. We believe that work does more than provide people with a living. It also gives them the opportunity to be a productive member of society.
Vebego therefore has a strategic objective to provide job opportunities to people facing barriers to employment. Our goal is clear: by 2030, 25% of our total workforce across Vebego should consist of employees who have experienced obstacles to entering or staying in the labour market. While this target applies Group-wide, it may vary between companies. Earlier, the target for our Dutch businesses was set at 30%, this has now been adjusted and expanded to a 25% target across all four countries. Due to varying interpretations and legislation across these countries, we had to revise it slightly. Fortunately, this allowed us to establish a clearer definition.
Barriers can take many forms: physical, mental, medical and social. And the way we create opportunities for these individuals varies widely across countries and contexts. That’s why, in 2023, we asked each of our companies to identify their target groups and decide for themselves how they can contribute to the overall goal. Since then, companies have been working to increase their impact, with progress monitored through the Value Creation Dashboard.
Privacy regulations can sometimes limit our ability to identify specific target groups. Of course, we fully respect these rules. But for us, the focus is not on registration — it’s on creating work opportunities for people who face barriers to employment. In the Netherlands, the PSO (Prestatieladder Socialer Ondernemen) certification – held by several of our companies – helps us gain more insight into our social impact. We are currently exploring similar certification options in Belgium and Germany. Assist Analytics enables us to collect self-reported data, which we plan to expand further in the coming year to include broader inclusivity metrics.
Other social topics
In addition to our efforts around inclusive employment, we are also expanding our focus on other social impact topics identified in our double materiality assessment. Starting in 2025 and continuing into 2026, we will work to strengthen our performance management in these areas, setting clear priorities for defining KPIs, establishing baselines and targets, and building roadmaps to track our progress.
